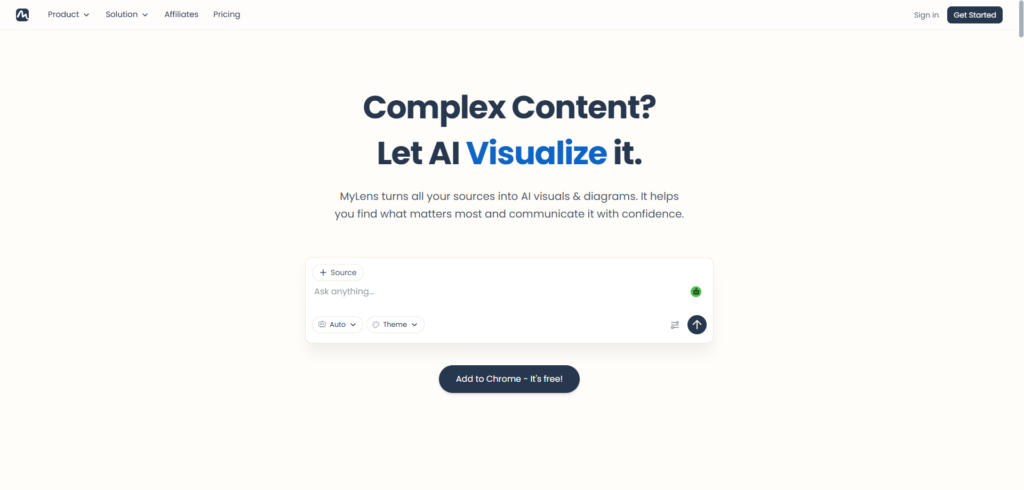
MyLens Review 2026: Turn Complex Ideas Into Visual Stories, Timelines, and Mind Maps in Minutes
Information is everywhere.
Every day, professionals, students, researchers, marketers, and business owners consume articles, reports, videos, PDFs, meeting notes, and endless streams of online content. The challenge is not finding information anymore. The real challenge is understanding it, organizing it, and turning it into something useful.
Reading a lengthy report can take hours. Analyzing research papers requires focus and patience. Even simple tasks like comparing ideas or identifying patterns across multiple sources can become overwhelming when dealing with large amounts of information.
Visual learning solves part of this problem.
People often understand information faster when it is presented visually rather than as blocks of text. Timelines, mind maps, flowcharts, and knowledge graphs help reveal relationships that are difficult to spot in traditional documents.
This is where MyLens comes in.
MyLens is an AI-powered visualization platform that transforms information into visual formats such as timelines, mind maps, tables, comparisons, and interactive knowledge structures. Instead of manually creating diagrams and summaries, users can upload content or provide prompts and receive organized visual representations within minutes.
In this MyLens review, we’ll explore how the platform works, its features, pricing, benefits, and whether it is worth using in 2026.
Why Visual Learning Matters More Than Ever
Modern professionals spend a significant amount of time processing information.
A typical workday may involve:
- Reading documents
- Reviewing research
- Analysing reports
- Studying competitors
- Taking meeting notes
- Planning projects
- Learning new topics
The volume of information can quickly become difficult to manage.
Even highly organized teams often struggle with:
- Information overload
- Poor knowledge retention
- Slow decision-making
- Fragmented research
- Disconnected insights
- Complex project planning
Visual representations can help solve these problems by making information easier to understand and remember.
Research consistently shows that visual learning can improve comprehension, pattern recognition, and information recall.
As AI tools become more capable, automated visualization platforms are making these benefits accessible without requiring design expertise.
What Is MyLens?
MyLens is an AI-powered visual thinking and knowledge visualization platform.
The software converts information into visual formats that help users explore, understand, and communicate ideas more effectively.
Instead of reading through long documents repeatedly, users can generate visual representations that highlight key relationships and insights.
The platform supports multiple visual formats, including:
- Timelines
- Mind maps
- Knowledge graphs
- Comparison tables
- Flowcharts
- Concept maps
- Visual summaries
The platform is designed for:
- Students
- Researchers
- Educators
- Consultants
- Business professionals
- Marketers
- Content creators
- Founders
Its primary goal is to make complex information easier to understand and share.
How MyLens Works
The platform focuses on simplicity.
Step 1: Add Information
Users can provide content in several ways.
This may include:
- Text prompts
- Articles
- PDFs
- Documents
- Research materials
- Notes
- Web content
The system processes the supplied information automatically.
Step 2: Analyse the Content
MyLens uses artificial intelligence to identify the following:
- Key concepts
- Relationships
- Important themes
- Chronological events
- Structural patterns
This analysis forms the foundation for visual outputs.
Step 3: Generate Visualisations
The platform transforms the information into visual formats based on the user’s goals.
Examples include:
- Timelines
- Mind maps
- Comparison charts
- Knowledge diagrams
Step 4: Explore and Share
Users can review, refine, and share visual outputs with colleagues, clients, students, or team members.
MyLens Review: Key Features
1. AI-Powered Visualisation
The platform’s primary feature is automatic visualization.
Instead of manually building diagrams from scratch, users can generate visual structures using AI.
This significantly reduces the time required to organize complex information.
2. Timeline Generation
Timelines are particularly useful when analyzing the following:
- Historical events
- Company growth
- Product development
- Project milestones
- Industry trends
MyLens can automatically convert information into chronological visual representations.
This makes it easier to understand sequences and relationships over time.
3. Mind Maps
Mind maps remain one of the most effective tools for brainstorming and learning.
The platform can transform content into structured mind maps that highlight:
- Core topics
- Supporting ideas
- Subcategories
- Relationships
This format is especially useful for planning and research.
4. Knowledge Graphs
Knowledge graphs help visualize connections between people, ideas, concepts, and organizations.
Rather than viewing information as isolated pieces, users can explore interconnected networks of knowledge.
This is particularly valuable for research-heavy work.
5. Comparison Tables
Decision-making often requires comparing options.
The platform can generate structured comparisons that make it easier to evaluate:
- Products
- Competitors
- Technologies
- Strategies
- Research findings
This feature helps simplify complex evaluations.
6. Visual Summaries
Long documents can be difficult to digest quickly.
MyLens can convert lengthy information into concise visual summaries that capture essential points.
This is useful for executives, researchers, and professionals who need rapid insights.
7. Interactive Exploration
Users are not limited to static outputs.
Visual structures can often be explored and refined, creating a more dynamic learning experience.
8. Collaboration Support
Visual content is easier to share and discuss than lengthy written reports.
Teams can use generated visuals to improve communication and alignment.
Benefits of Using MyLens
Save Research Time
Visual summaries help users understand information more quickly.
Improve Knowledge Retention
Visual formats are often easier to remember than traditional text documents.
Simplify Complex Topics
Relationships between ideas become easier to identify when displayed visually.
Improve Team Communication
Visual content often creates clearer discussions and better alignment.
Support Better Decision-Making
Structured comparisons and visual analysis can help users evaluate options more effectively.
Reduce Information Overload
Organizing information visually makes large datasets and documents easier to navigate.
Who Should Use MyLens?
Students
Students can simplify learning materials and improve study efficiency.
Researchers
Researchers can visualize relationships, timelines, and knowledge structures across large amounts of information.
Educators
Teachers can create visual learning resources that improve engagement and understanding.
Consultants
Consultants can present insights and recommendations in more accessible formats.
Business Professionals
Professionals can organize research, reports, and strategic planning materials more effectively.
Marketers
Marketing teams can map campaigns, customer journeys, and competitive landscapes visually.
Founders
Startup founders can use visual planning tools to organize ideas, strategies, and growth initiatives.
MyLens Pricing
MyLens offers subscription options suitable for individual users and teams.
Plans generally vary based on:
- Usage limits
- Visual generation volume
- Collaboration features
- Advanced functionality
- Team access
Because pricing structures can change, users should review the official website for the latest information before subscribing.
Pros and Cons
Pros
- Fast visualisation of complex information
- Multiple visual formats
- Useful for research and learning
- No design skills required
- Improves information organisation
- Supports collaboration
- Suitable for many industries
- Easy to use
Cons
- Advanced features may require premium plans
- Complex topics may still require manual refinement
- Visual outputs depend on source content quality
- Some users may prefer traditional note-taking methods
How MyLens Helps Different Types of Users
One of the platform’s strengths is its flexibility.
Different users can apply visualization in different ways.
Students and Learners
Convert study materials into mind maps and timelines for faster understanding.
Researchers
Explore connections between concepts, studies, and findings.
Business Teams
Organize projects, strategies, and reports into visual frameworks.
Content Creators
Plan content structures and organize research more effectively.
Consultants
Transform complex findings into client-friendly visuals.
This versatility expands the platform’s usefulness beyond a single niche.
MyLens vs Traditional Diagram Tools
Traditional visualization software often requires users to build diagrams manually.
This process usually involves:
- Creating structures
- Organising nodes
- Drawing relationships
- Formatting visuals
- Managing layouts
While these tools offer flexibility, they can be time-consuming.
MyLens takes a different approach.
Instead of building diagrams manually, users start with information and allow AI to generate visual structures automatically.
This shifts the focus from design work to understanding information.
For many users, that distinction represents a significant productivity advantage.
Best Use Cases for MyLens
Research Analysis
Transform reports and studies into visual insights.
Educational Content
Create engaging learning materials from complex subjects.
Strategic Planning
Map goals, initiatives, and business strategies visually.
Competitive Analysis
Compare competitors, products, and market positions.
Project Management
Visualize timelines and milestones for improved planning.
Knowledge Management
Organize internal information into searchable visual structures.
Why AI Visualisation Tools Are Growing
The amount of information people handle continues to increase.
As a result, businesses and individuals are looking for faster ways to understand complex subjects.
AI-powered visualization tools help bridge the gap between information collection and understanding.
Instead of spending hours organizing data manually, users can focus on:
- Learning
- Decision-making
- Strategy
- Communication
- Problem-solving
This shift is driving growing interest in platforms like MyLens.
Final Thoughts
Understanding information is often more important than simply collecting it.
The challenge today is making sense of growing volumes of content without becoming overwhelmed.
MyLens addresses this challenge by transforming information into visual formats that are easier to explore, understand, and share. Its ability to generate timelines, mind maps, comparison tables, and knowledge graphs makes it useful across education, business, research, and content creation.
For students, professionals, researchers, consultants, and teams looking for a faster way to organize knowledge and uncover insights, MyLens is a platform worth exploring in 2026.
Frequently Asked Questions (FAQ)
What is MyLens?
MyLens is an AI-powered visualization platform that transforms information into timelines, mind maps, knowledge graphs, and other visual formats.
Who should use MyLens?
Students, educators, researchers, consultants, marketers, founders, and business professionals can benefit from the platform.
Can MyLens create mind maps automatically?
Yes. The platform can generate mind maps from uploaded content and user prompts.
Does MyLens support timelines?
Yes. Timeline generation is one of its core visualization features.
Can MyLens analyze documents?
Yes. Users can upload documents and convert their content into visual summaries and knowledge structures.
Is MyLens worth it?
For users who regularly work with complex information and want a faster way to organize, understand, and communicate ideas, MyLens offers a practical and highly accessible solution.